Ecommerce · 7 min
Your Best Customers Already Reverse-Engineer Your Size Chart. Help Them.
Experienced online shoppers pick a size by measuring a garment they already own and matching it to your chart. Most size charts make that impossible. Here is how to fix yours.
Di Davide Mastricci, Founder · 28 luglio 2026
The trick a merchant told me
I was talking to a merchant last week about why shoppers still get the size wrong on his store. He told me what his most loyal customers actually do, and it stopped me:
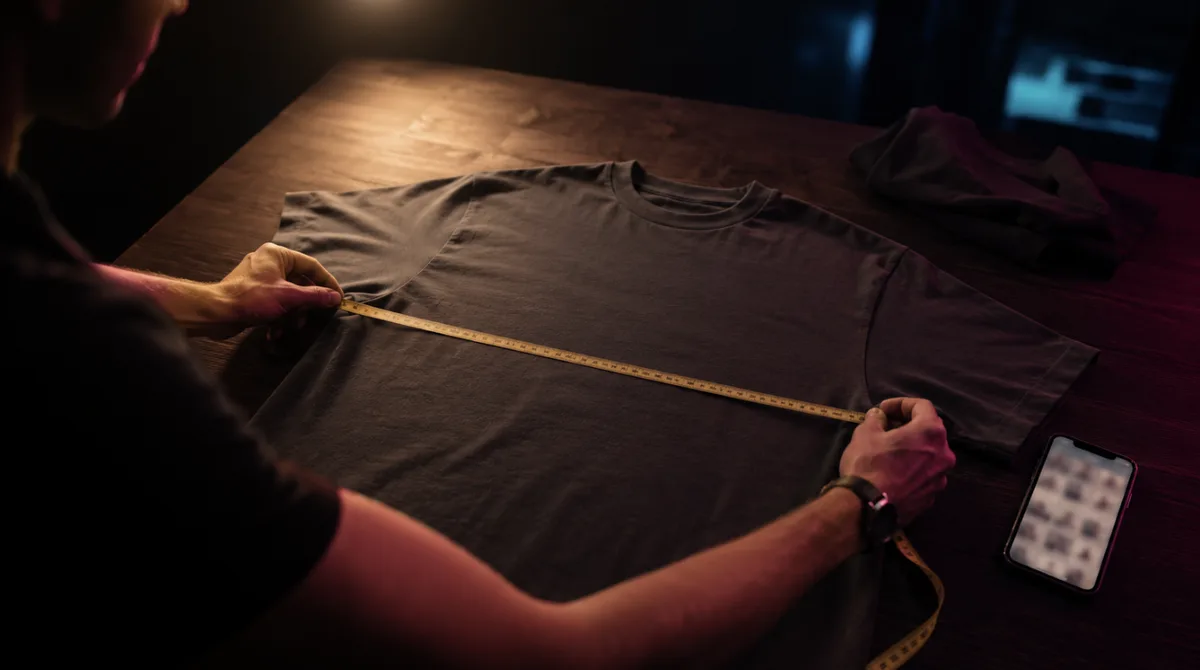
They take a t-shirt they already own, one they love the fit of, even from a completely different brand. They lay it flat and measure it. Then they compare those numbers to the size guide on my site and pick whichever size is closest.
No body measurements. No guessing whether they are "a medium." They treat a garment they already trust as the reference object, and they treat your size chart as a lookup table.
He said it works especially well for oversized fits, which is exactly where you would expect standard sizing to fall apart.
This is worth sitting with, because it tells you something uncomfortable. The shoppers doing this are not confused beginners. They are your most experienced, highest-intent customers. And they are doing manual work with a tape measure because your product page did not give them a usable answer.
Why the trick works
A t-shirt that fits you well is a physical record of a fit you already validated. It encodes everything a body measurement leaves out: how much ease the cut has, where the shoulder seam falls, how long the body is, how the sleeve sits. You wore it, you liked it, the question is settled.
Body measurements do not carry any of that. If your chart says size M is for a 96 to 101 cm chest, the shopper has to do two conversions in their head. First, measure their own chest correctly, which most people do badly. Second, guess how much room your particular cut adds on top of that. The second conversion is the one nobody can do, because ease is a design decision you never published.
Garment measurements skip both. A shopper who knows their favourite tee is 54 cm across the chest laid flat can look at your chart, find the size that is 54 cm or a little wider, and be done. One comparison, two numbers, same units, no interpretation.
That is why the flat-lay method beats the body-measurement method for anyone who has done it once. It replaces a guess with a match.
Oversized fit is where this becomes the only method
For a slim or regular cut, body measurements are at least directionally useful. For oversized, they are close to meaningless.
"Oversized" is not a size, it is a design intent, and every brand implements it differently. One brand's oversized tee is a regular body with dropped shoulders. Another adds 10 cm of chest and keeps the shoulder seam in place. A third does both and shortens the body. A shopper with a 98 cm chest cannot infer any of that from a body-measurement chart, and the usual advice to "size up if you want it looser" is actively wrong here, because many oversized cuts already have the extra room built in. Size up on top of that and the shopper ends up in a tent.
The merchant's customers sidestep the whole problem. They are not asking "what size am I." They are asking "which of your garments is shaped like the one I already love." For oversized, that is the only question that produces a reliable answer, because the shopper's reference garment is the only place the intended looseness is actually recorded.
What this behaviour tells you about your product page
Three things, and none of them are flattering:
Your chart is being used as a data source, not as guidance. The shopper is not reading your sizing advice. They are extracting numbers from it and doing arithmetic. If your chart is a JPEG of a table, or it lists ranges instead of values, or it only has body measurements, you have broken their workflow and they will either guess or order two sizes.
The shoppers doing this are the ones you least want to lose. Getting out a tape measure is friction that only high-intent buyers accept. Everyone else bounces or orders two sizes and returns one. So the cost of a bad size chart is not spread evenly. It lands on your best customers and on your return rate at the same time.
You already have the data. Finished garment specs exist. Your manufacturer measured them, your tech pack lists them, your QC sheet checks them. They are sitting in a spreadsheet somewhere and not on your product page.
Four changes that make your size chart usable
1. Publish flat-lay garment measurements, not just body measurements. Chest width laid flat, body length from the high point of the shoulder, shoulder seam to shoulder seam, sleeve length. Publish them as single numbers per size, not ranges. Keep the body-measurement table too if you like, since first-time buyers still use it, but the garment table is the one that closes the loop for the flat-lay method. Label clearly which is which, because a chest number that is ambiguous between "flat width" and "full circumference" is worse than no number at all.
2. Say what the fit is meant to be. One sentence per product: "Oversized: dropped shoulder, roomy through the body, true to size. Do not size up." That single line prevents the most common oversized mistake, and it is the piece of information that only you have.
3. Tell shoppers what the model is wearing. Model height plus the size on their body converts a flat photo into a calibrated reference. It costs one line of copy and it is the closest thing to a free win on this list.
4. Make the numbers per product, not per brand. A single store-wide chart is the root cause of most of this. Your boxy tee and your fitted tee do not share a size M, and shoppers learn quickly that a brand-level chart cannot be trusted. Per-product specs are more work to maintain and they are the difference between a chart that gets used and one that gets ignored.
If you do nothing else, do the first one. It is the change that turns your size chart from a suggestion into something a shopper can actually compute against.
How to know whether it worked
Do not judge this by your overall return rate. Overall return rate moves for a dozen reasons at once and will tell you nothing about a size chart change.
Isolate the fit-related portion instead: capture a structured return reason at the point of return, then track size and fit returns as a share of orders on the specific products where you added garment measurements. Same product, before and after, over a fixed window. That is the only comparison that answers the question. The full method is in our guide on measuring fit-related returns, and the broader benchmarks are in the 2026 return rate figures.
Expect the effect to be uneven. It should be largest on the products where fit is least obvious from a photo, which usually means oversized cuts, outerwear, and anything with an unusual silhouette. On a basic fitted tee it may do very little, because shoppers were already getting that one right.
One honest caveat
This does not solve sizing. It removes an obstacle for the subset of shoppers who are already motivated enough to measure something, and it makes your product page honest about a fit intent you previously left implicit. That is a real improvement and it is not a transformation.
Most shoppers will never get out a tape measure. For them the lever is different: better on-body imagery, clearer fit language, and tools that let them see the garment on a real body before they commit, which is the territory we cover in whether virtual try-on is worth it and how try-on relates to returns.
But the merchant's story points at something the sizing conversation usually misses. The people who care most about getting the size right have already invented a method that works. The least you can do is publish the numbers it needs.